The tool I use most as a data analyst is python pandas. It works with all data formats, sql, and cloud solutions like aws/google/microsoft. I think the biggest challenge I have recommending it to friends and colleagues is that it’s pretty intimidating. Most analysts have some experience with programming using excel, macros, or VBA.
But it is a huge jump from being able to understand the logic behind programming and getting something to a programming language and their dependencies working on your computer. I’ll show you a stable way to get it on your computer. How to automate calculations between columns, clean dates, and generate a pivot table without opening excel.

Getting the right python version, packages, and system variables can be a huge frustration getting started. To simplify this we are going to use a docker. Seems pretty crazy to add another piece of complicated technology to get the first complex technology to work. But it will be easier to get started with a couple of commands trying to install it from scratch.
There also other ways use pandas like: google colab, aws sagemaker, and the jupyter team have made docker “stacks” themselves.
Getting Started
Step 0: Download git (Git – Installing Git) and docker (Docker Desktop for Mac and Windows). They might take a few mins to download. This works on both Apple and PC.
On windows, you have to make sure you’re running the most up to date version. Also need to have WSL installed, but that should come with docker.
Step 1: Open terminal / wsl (windows)
Step 2: Change the directory to your desktop. Type the following.
cd ~/Desktop/Step 3: Download my repo on github.
git clone https://github.com/kylepierce/pandas-docker-example.gitStep 4: Go into the repo directory
cd pandas-docker-exampleStep 5: Type in following command.
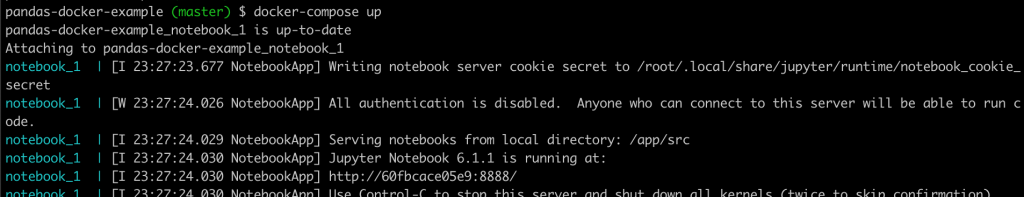
docker-compose upDocker compose should come with the docker for mac or windows desktop app. If you get an error you can make sure you have it installed by typing “docker-compose –help” now you should have a screen that looks like this
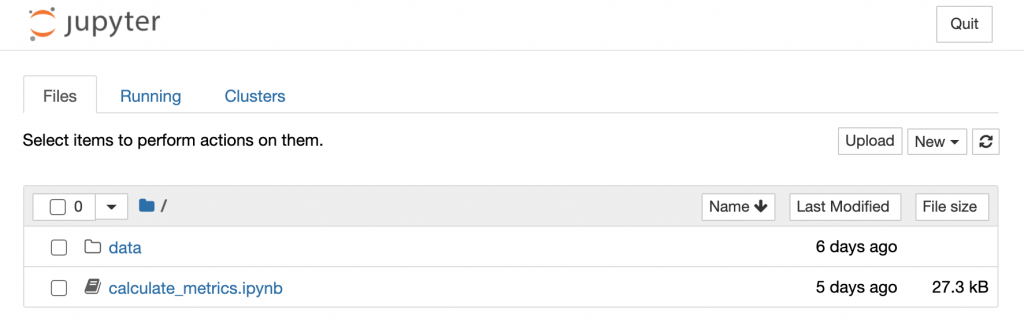
If you go to https://localhost:8888 you should see this.
Digging into the data
Now that we have the infrastructure out of the way we can focus on the programming side.
This is your “file system”. Right now there are two items. There is a data folder where CSV is located and there is a file called ‘calculate_metrics.ipynb’
If you open calculate_metrics.ipynb you’ll see this.
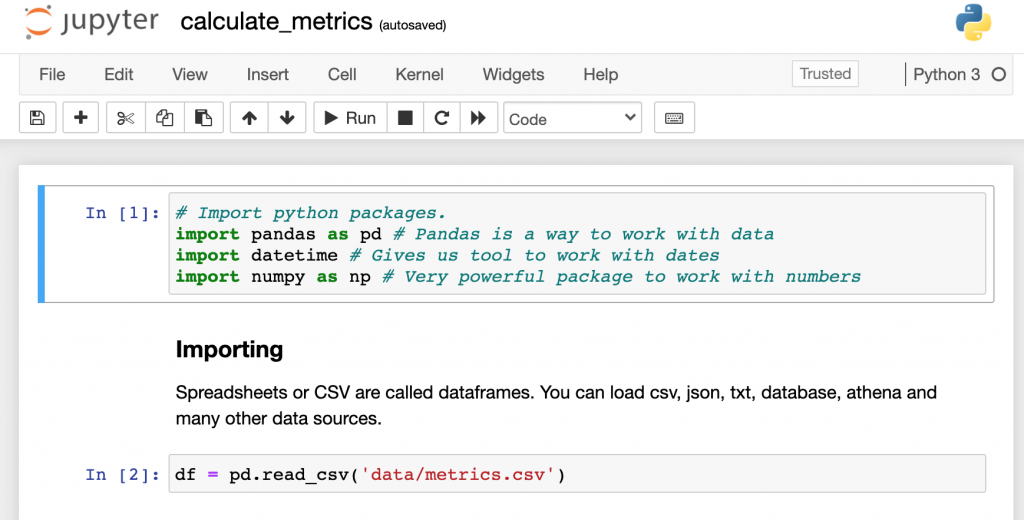
Notebooks are a great way to learn because you can run individual code blocks one at a time and see their output. If one breaks you’ll know pretty quickly.
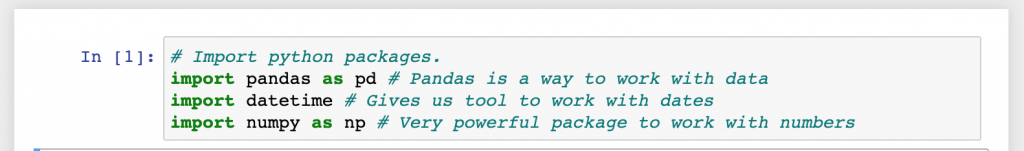
Click on a Cell (hover and see a border appear around each cell) and hit the Run button at the top of the page. You’ll see a green asterisk spinning and then turn into 1 when the cell it’s complete. You just imported the Panda’s package!
The first thing we will do is to load our data into our notebook. I included a dummy ‘metrics.csv’ file in the ‘Data’ folder. Click on the 2nd cell and click run again and our CSV will be turned into a DataFrame. Dataframe is similar to a spreadsheet it gives more tools to manipulate data.
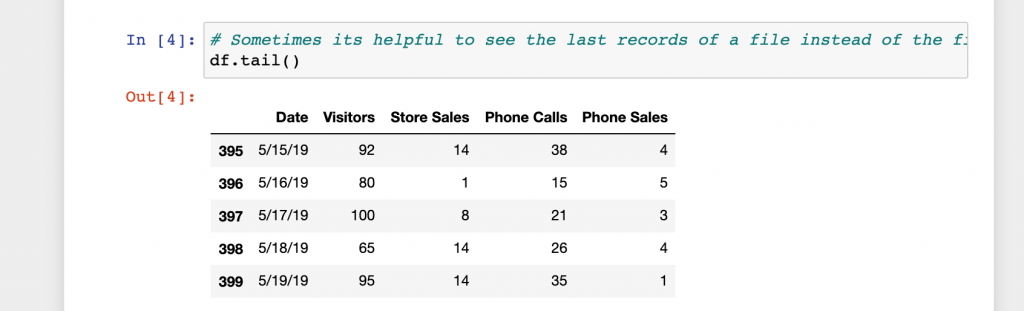
In the see your data section there are a few ways to view the data. Click run on each cell to see the output.
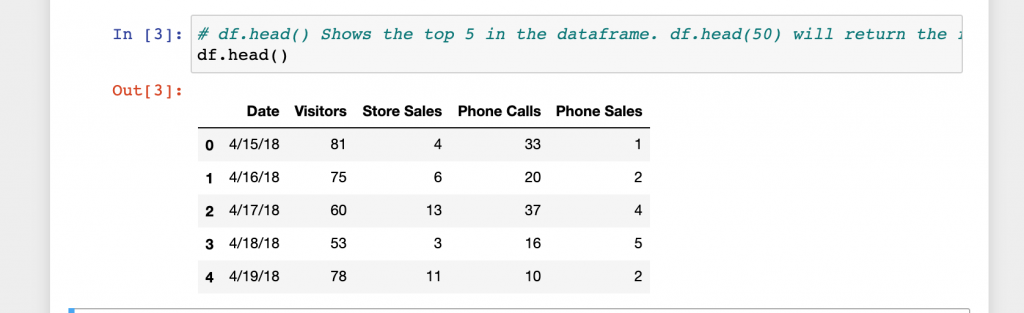

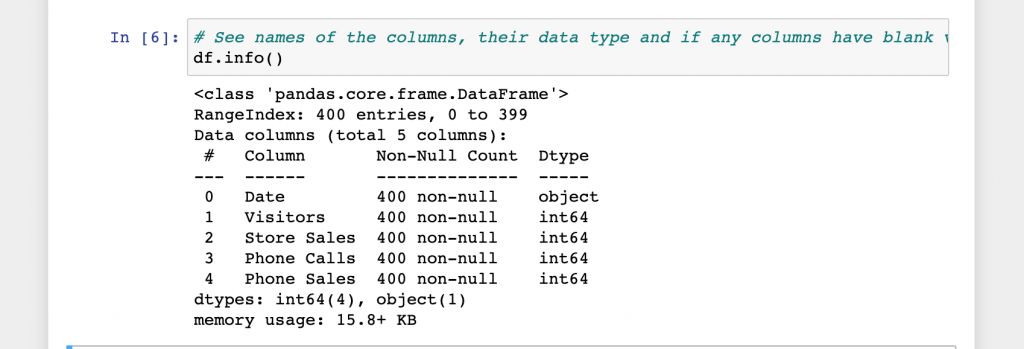
That not be too exciting for a small file, but if you’re working with a file has a million rows or 100’s of columns it might be nice to see their names and what type of data before working on it.
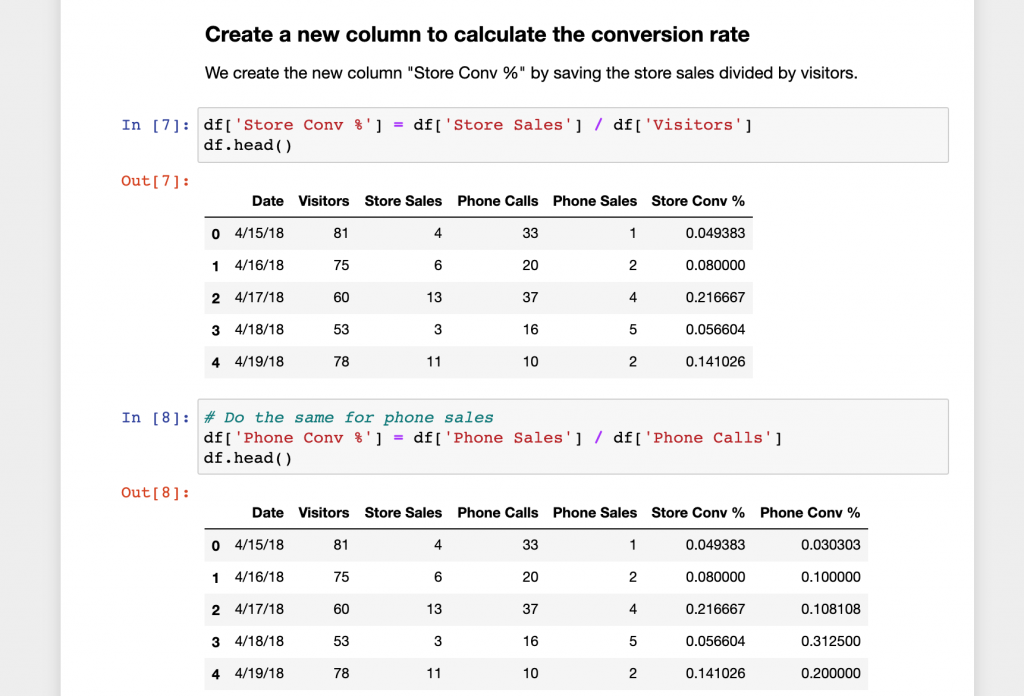
Now to get into more interesting things. Say we want to decide to hire another store salesperson or phone salesperson. We can calculate the conversion rate for in-store and sales by phone calls to help us make our decision.
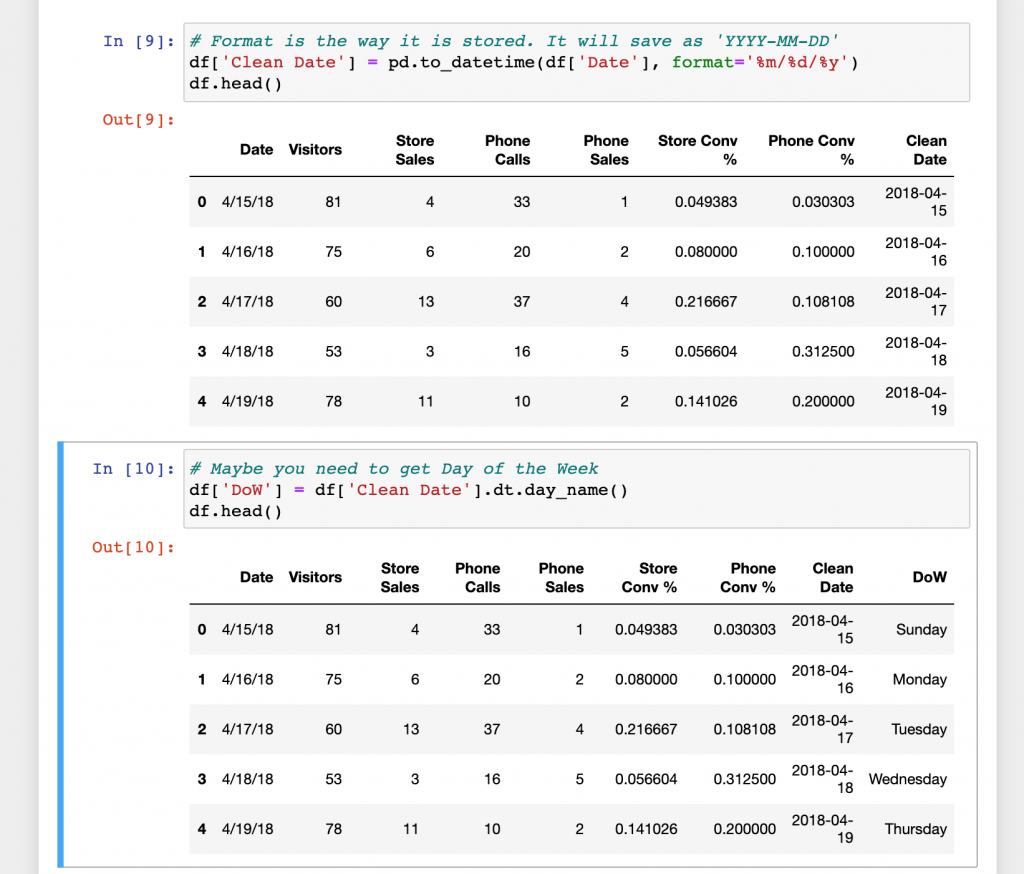
Pretty simple! Now we can convert the date to the standard date YYYY-MM-DD and find each day’s day of the week (Monday, Tuesday…).
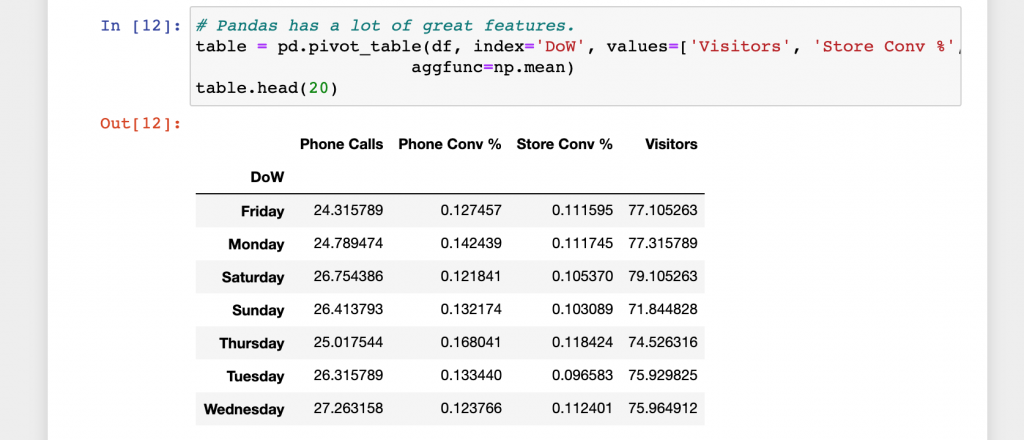
Finally put the new day of the week day into a pivot table to see which days have the highest average conversion % for in store and over the phone. The last cell will save the pivot table as a csv.
This might seem like a lot of work to generate a pivot table. But what if this csv was sent every day? or you had to do this for hundreds of stores?
This is just a small part of what you can do with pandas. If you want to learn more there are great youtube videos and some great books to get started with pandas. Hopefully to can see the power of the tool and a simple ecosystem to start testing!
If you have any comments or questions let me know in the comments!